
Data Visualization
Engaged storytelling through interactive data viz built with d3.js
Interactive dot plot -- blockbuster top ten movies per year
Interactive chord graph -- blockbuster top ten movies per year
Interactive choropleth map -- Average prices of red and white wine in different U.S. states
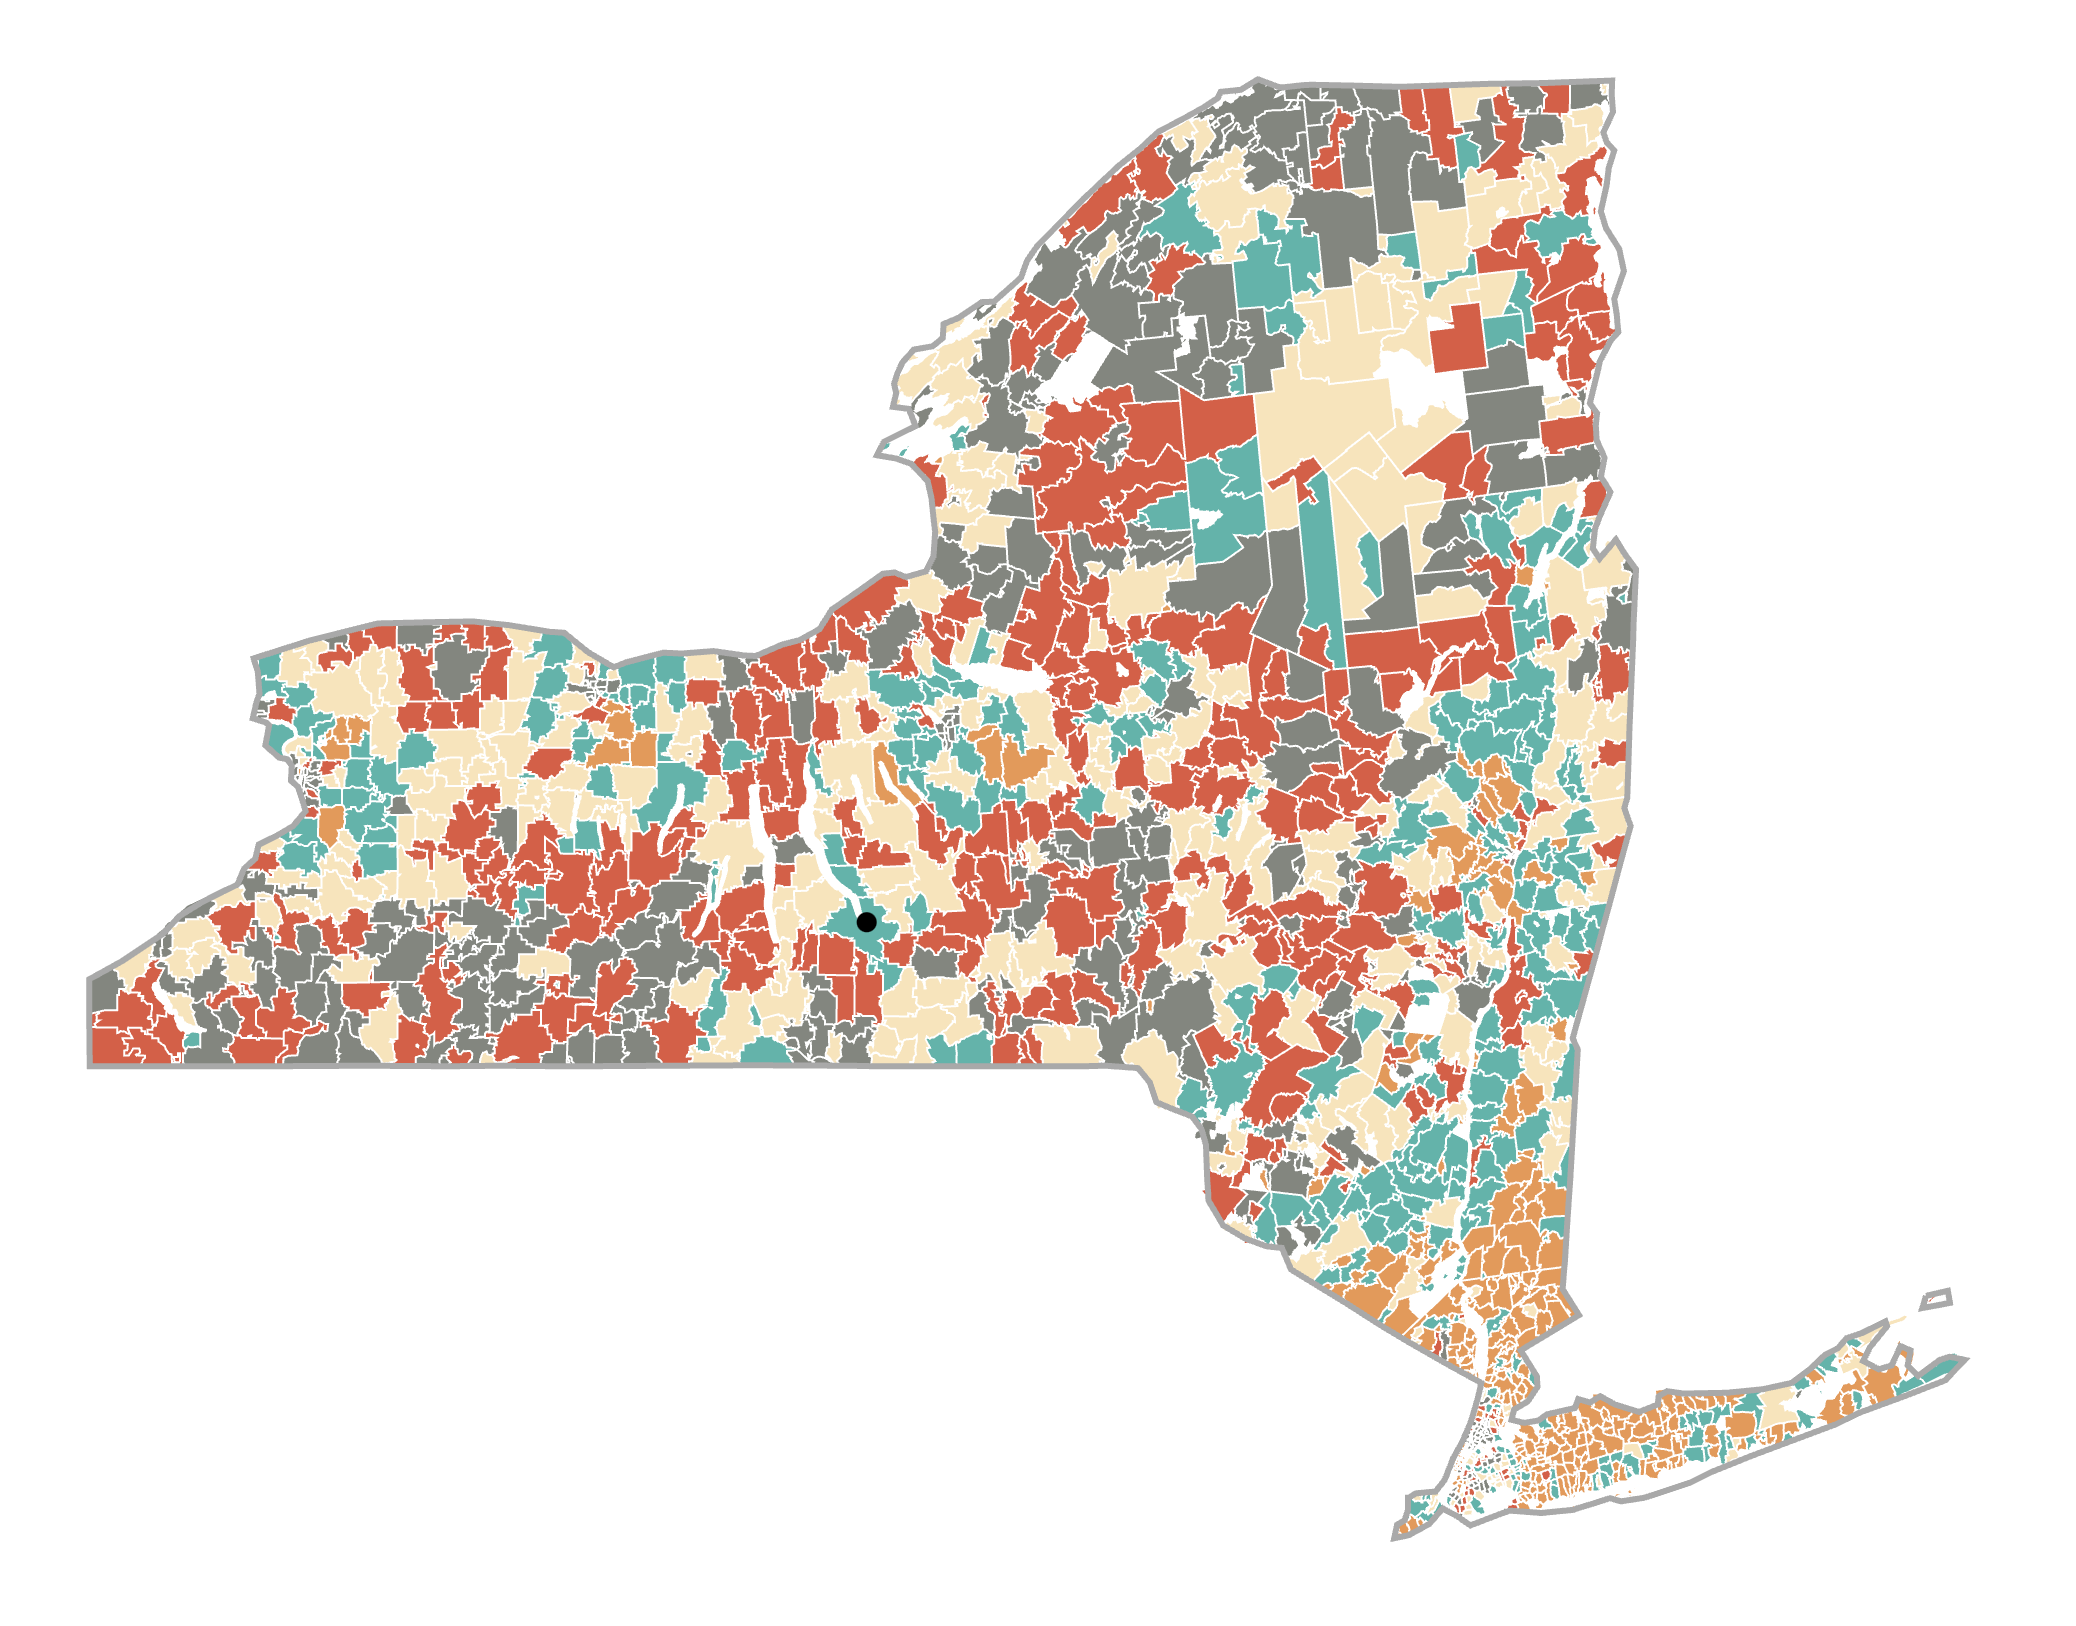
Choropleth Map of median family income for ZIP codes in New York state.
Interactive dot plot -- BBC survey of music critics on the greatest hip-hop songs of all time
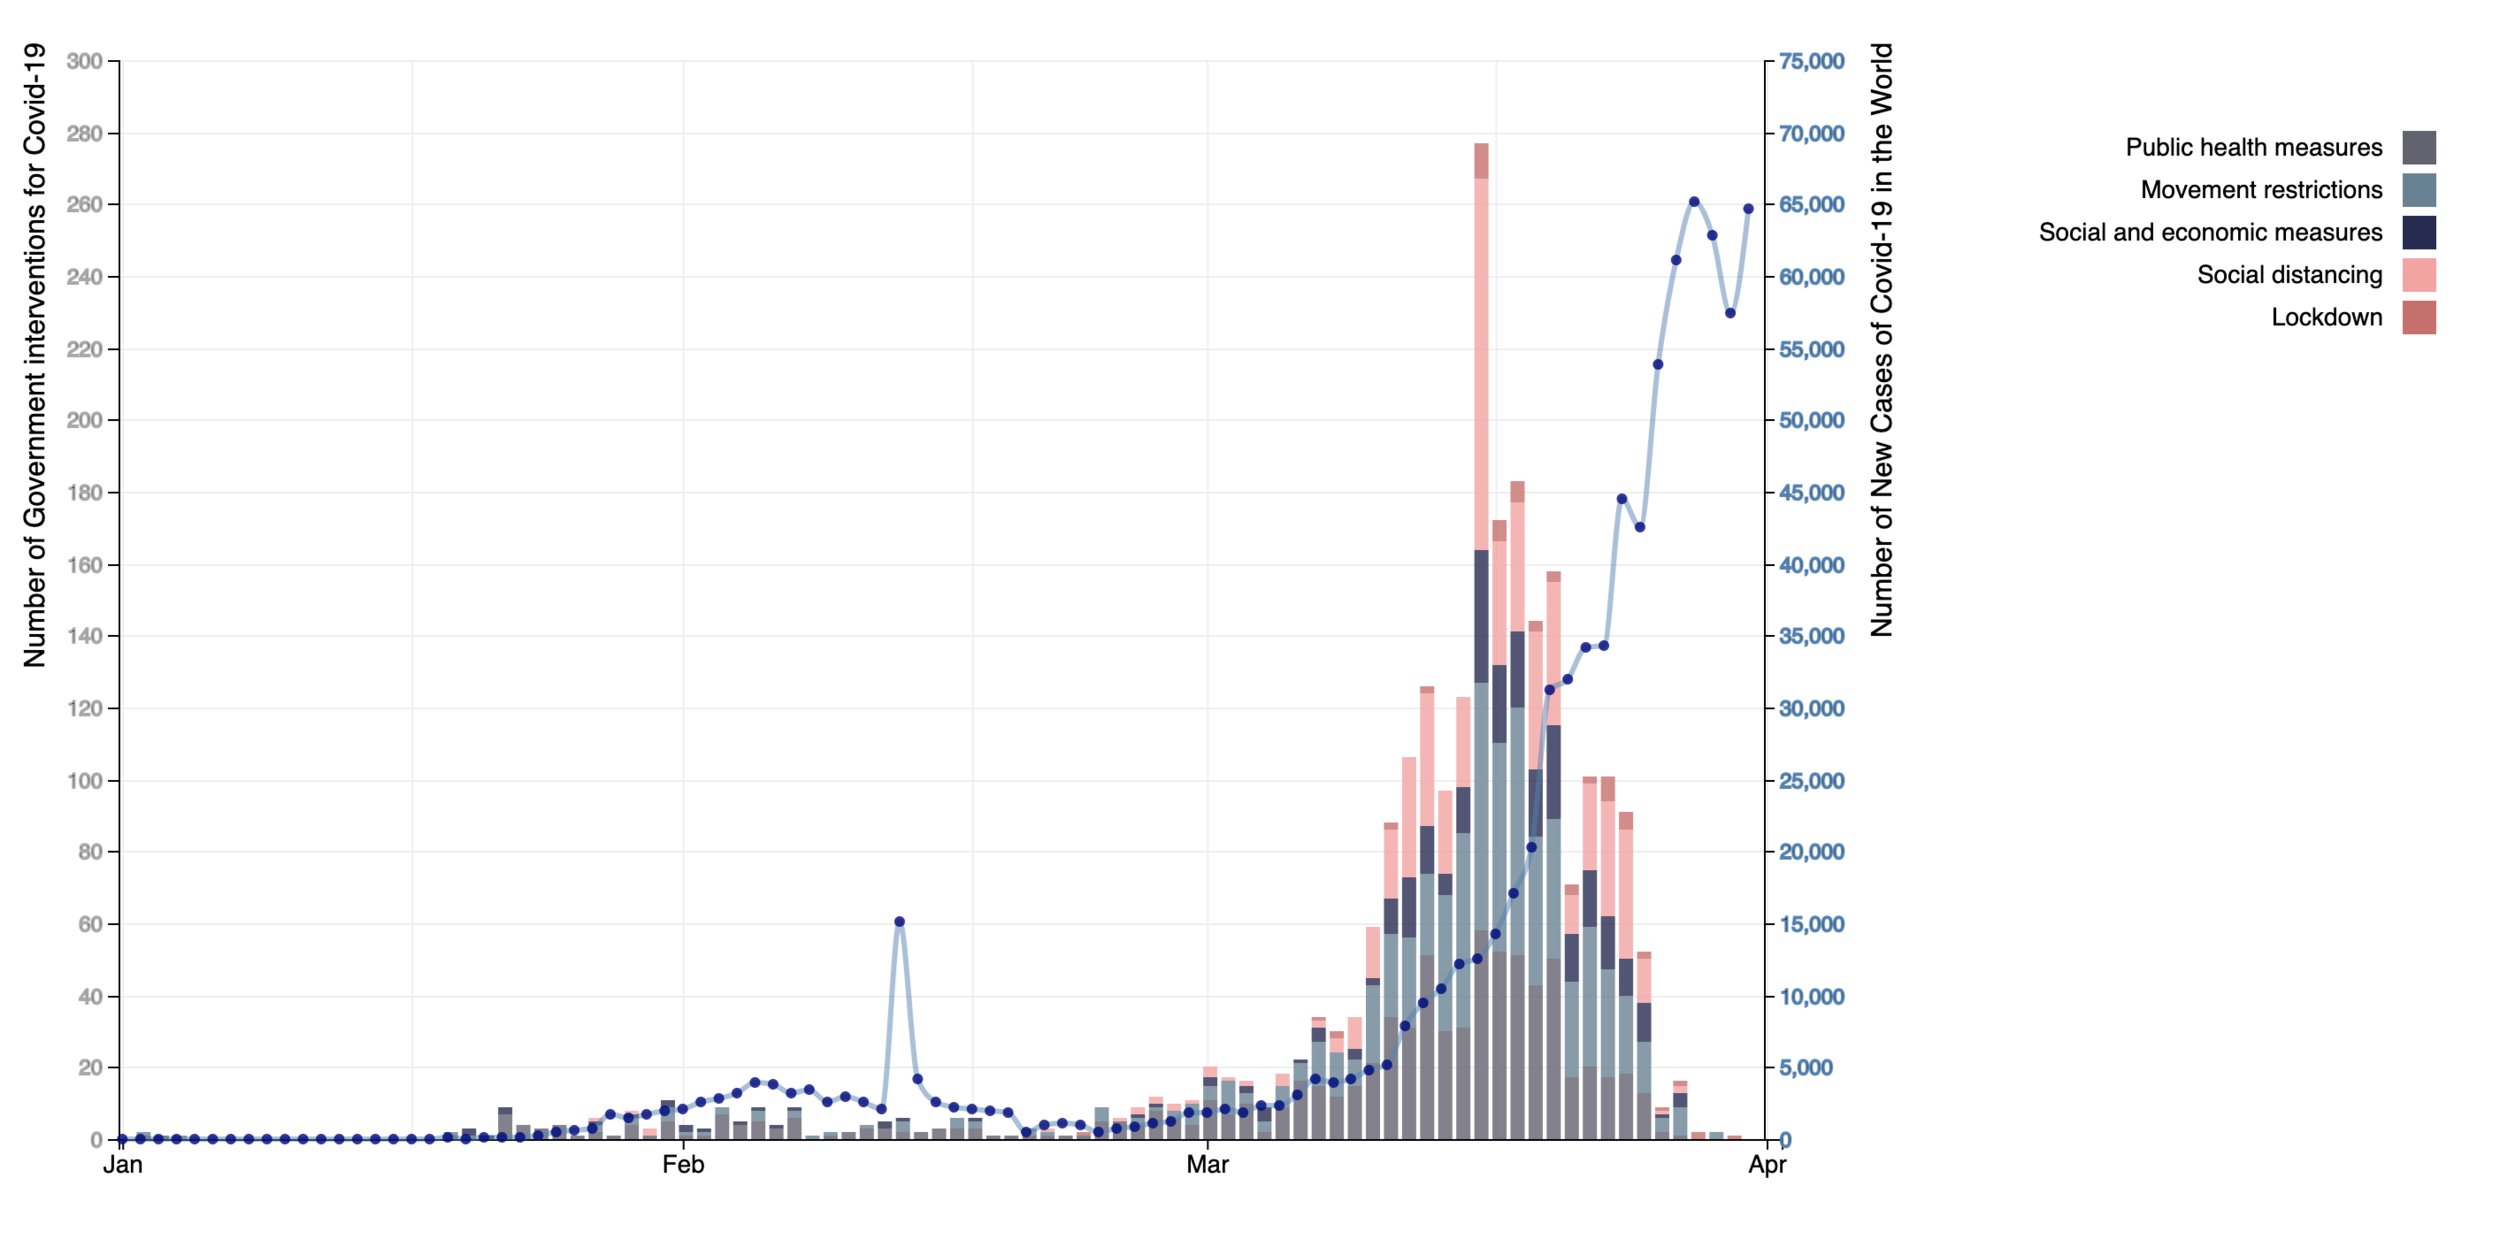
Impact of government interventions for COVID-19 around the globe on the number of new cases between January and April 2020